
Solar Battery Degradation Rate: Understanding Capacity Loss and Longevity
April 24, 2026
AC Breakers in Solar Installation: How to Choose the Right Size for Safe AC Protection
April 28, 2026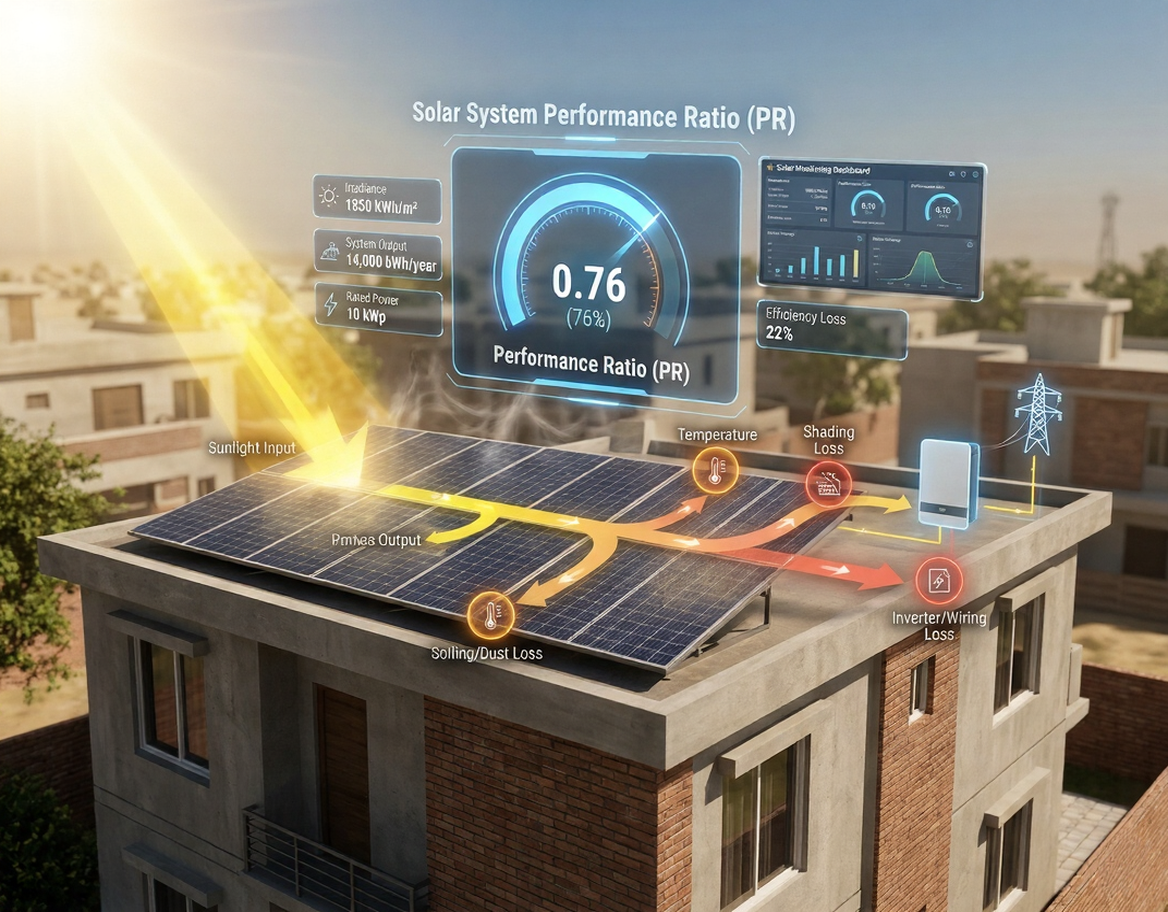
Your solar system generates power every single day. The meter shows healthy numbers. But is it actually performing well, or is it quietly losing yield to problems you cannot see?
This is exactly what the performance ratio (PR) answers. Raw generation numbers tell you how much energy a system produced. PR tells you how efficiently it uses the available sunlight. Those are two very different questions, and confusing them is one of the most common mistakes solar owners make in Pakistan.
By the end of this article, you will know what PR means, how to calculate it, what a good number looks like in Pakistan’s climate, and what causes it to fall.
What Is Solar System Performance Ratio?
Performance ratio is a system-level quality metric. It compares the actual energy your solar system delivered against the energy it theoretically could have delivered, given the sunlight available at your location.
PR is expressed as a decimal or percentage. A PR of 0.78 means your system converted 78% of the available solar resource into usable electricity. The remaining 22% was lost to heat, wiring resistance, dust, inverter conversion, and other real-world factors.
What makes PR especially useful is that it is independent of location. A system in Multan and a system in Karachi can be compared using PR, even though one receives more sunlight than the other. It strips out the weather variable and focuses entirely on how well your system converts whatever sunlight it receives.
How to Calculate Solar System Performance Ratio
The Formula
The standard PR formula, defined under IEC 61724, is:
PR = E actual / (H irr x P rated)
Where:
- E actual = Energy the system delivered in kWh over the measurement period
- H irr = In-plane solar irradiation received during that period (kWh/m2)
- P rated = Installed peak power of the system in kWp
A Worked Example
Take a 10 kWp rooftop system in Lahore. Over one year, the inverter monitoring shows it delivered 14,000 kWh. In-plane irradiation data show 1,850 kWh/m2 for the year.
PR = 14,000 / (1,850 x 10) = 14,000 / 18,500 = 0.757 or 75.7%
Most monitoring platforms calculate this automatically. Understanding the formula still matters because it helps you catch data errors and interpret what a changing PR number actually signals.
You can use our solar ROI calculator guide alongside PR tracking to get a complete picture of your system’s financial performance.
What Does a Good Performance Ratio Look Like in Pakistan?
Here is a practical benchmark table for reference:
|
PR Value |
What It Indicates |
|
Above 0.80 |
Strong performance, well-optimised system |
|
0.75 to 0.80 |
Acceptable, normal for warm climates |
|
0.70 to 0.75 |
Below average, worth investigating |
|
Below 0.70 |
Serious issue: soiling, shading, inverter fault, or degradation |
Here is the nuance most articles miss: Pakistan’s climate naturally produces lower PR than European benchmarks. High ambient temperatures reduce panel output throughout summer. A system in Multan or Faisalabad running at 0.74 to 0.76 is not underperforming. It is behaving exactly as expected for its climate.
Do not compare your PR against a European project showing 0.83. Compare it against your own system’s baseline over time, or against similar systems in a similar climate. That comparison gives you honest, actionable information.
Why Solar System Performance Ratio Drops: Understanding Efficiency Losses
Temperature Losses
This is the single largest efficiency loss in Pakistan’s climate. Solar panels carry a rating at 25°C under Standard Test Conditions. In summer, rooftop panel temperatures in Punjab regularly exceed 60 to 65°C.
Every degree above 25°C reduces output. The solar panel temperature coefficient determines exactly how much a specific panel loses per degree of temperature rise. High-temperature months will always show lower PR, and that is completely normal. What matters is whether your summer PR follows a consistent pattern year over year, or whether it keeps worsening.
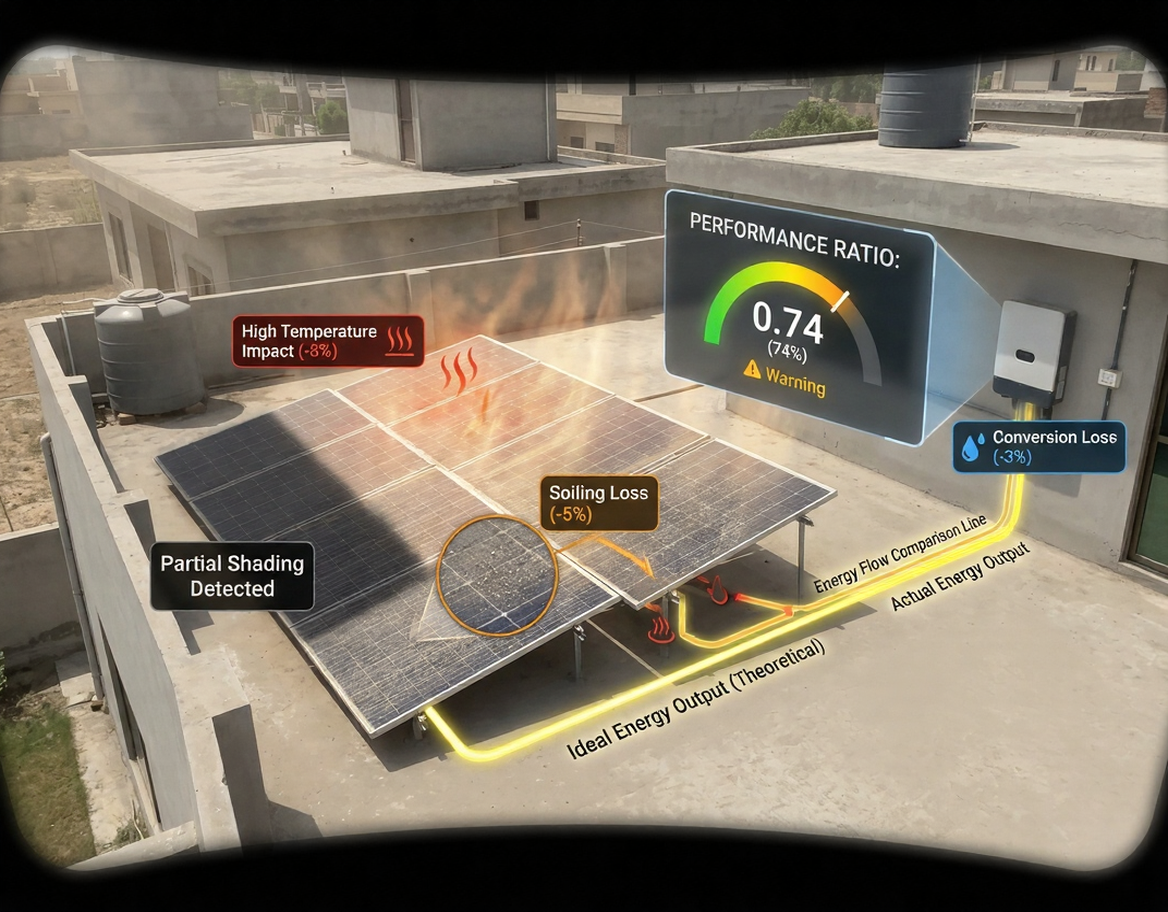
Soiling and Shading
Dust, bird droppings, and construction debris accumulate on panel surfaces and block incoming irradiance. In dry regions like interior Punjab and Sindh, soiling losses of 3 to 7% are common without regular cleaning. Even a thin dust layer that looks harmless can cut PR noticeably over a month.
Shading from a newly built boundary wall, a water tank, or tree growth can cause disproportionate losses in string-wired systems. One shaded panel pulls down the entire string it belongs to. Our maintenance tips for solar systems in Pakistan’s climate cover a practical cleaning schedule that keeps soiling losses from compounding silently.
Inverter and Wiring Losses
No inverter operates at 100% efficiency. Typical conversion losses fall between 2 and 4%. A well-specified inverter running within its rated range keeps this loss minimal. An undersized or ageing inverter running near its limits adds more.
DC and AC wiring resistance also reduces yield. Undersized cables, long cable runs, and loose MC4 connections all contribute. These losses are mostly fixed at installation, which is why proper DC cable sizing for solar and correct AC protection for your solar system matter from day one, not as an afterthought.
System Downtime and Inverter Clipping
Unplanned outages, inverter faults, and grid disconnections reduce actual energy output without reducing the irradiation the system received. This pulls PR down directly. Grid instability in Pakistan makes this more relevant than in stable-supply markets.
Clipping occurs when your array generates more DC power than your inverter can convert to AC. On very bright days, the inverter caps its output at its rated capacity. Some clipping is by design and acceptable. Excessive clipping from a badly sized inverter is a real and recoverable loss.
Understanding inverter efficiency ratings helps you read inverter specs correctly, so you avoid selecting equipment that introduces avoidable losses before your system even starts running.
Performance Ratio vs. Other Solar Metrics
PR is frequently confused with related metrics. Here is a clear comparison:
- Panel efficiency: A lab-rated specification for a single module under Standard Test Conditions. It tells you how much sunlight that panel converts under ideal conditions. It says nothing about how your full system performs in the field.
- Specific yield (kWh/kWp): Measures total energy output per unit of installed capacity. Useful for comparing locations, but does not isolate system losses the way PR does.
- Capacity utilisation factor (CUF): More commonly used in grid-scale project planning. It measures how much of the system’s maximum theoretical annual output it actually delivered.
PR answers one specific question: given the sunlight that reached your system, how efficiently did it convert that into usable electricity? The other metrics answer different questions entirely.
Our guide on solar panel efficiency comparison covers the panel-side metrics in detail if you want to go deeper on module selection and how lab ratings translate to real-world output.
How to Use Performance Ratio to Monitor and Improve Your System
PR is most powerful when tracked over time, not treated as a one-time number.
Here is a practical approach:
- Record your PR monthly using inverter monitoring data
- Compare each month against the same month from the previous year
- A consistent year-on-year decline points to degradation or an unresolved fault
- A sudden one-month drop signals an acute problem: soiling buildup, a new shading obstruction, an inverter fault, or a disconnected string
For larger commercial and industrial systems, compare your measured PR against a modelled baseline from PVSyst or similar software. The gap between modelled and actual PR is called the performance gap, and closing it is the core objective of any serious O&M programme.
One limitation worth knowing: PR does not capture downtime. A system that was offline for two weeks due to an inverter fault will show reduced energy output, but PR alone will not flag the cause. Track system availability separately, alongside the PR, for a complete picture. In Pakistan, where grid fluctuations regularly trigger inverter shutdowns, this matters more than most homeowners realise.
For homeowners who want a solid starting point, our step-by-step guide on how to size your home solar system in Pakistan includes monitoring guidance that naturally feeds into regular PR tracking.
Conclusion
A solar system that generates power is not the same as one that performs well. Performance ratio is what separates the two.
A strong PR means your system uses available sunlight efficiently. A declining PR means something is pulling it down, and in most cases, that something is fixable. Clean the panels, inspect the cabling, check the inverter, and review any new shading around the site.
Track your PR every quarter. Treat any sustained drop as a signal to investigate, not accept. And when you benchmark your numbers, do it against your own system’s history and Pakistan’s real climate conditions, not against a rooftop in Germany.
Independent Power: Connect with Enon Traders Today!
Start your off-grid journey with Pakistan’s most reliable solar partner.
| Connect With Us | Action Link |
| Chat Instantly on WhatsApp | Get an off-grid system quote: Click to Chat Now! |
| Visit Our Website | View our off-grid inverters: Official Website |
| Call Our Experts | Design your custom micro-grid: Contact Page |